
Security Compliance
SEM Performance Checks
This article provides guidelines and performance checks in Security Event Manager (SEM) to help verify if rules are firing or if the system is running slow.
First published date
11/29/2018 10:39 PM
Last published date
6/16/2025 4:40 PM
Overview
This article provides steps to validate the performance and rules engine of the Security Event Manager. No reservations or lack of reservations can result in file or file system corruption in addition to other errors (support will need to verify files and filesystems. ie... / or /tmp or /usr/local/contego).
Product section
Security Event Manager
Cause
There can be many different reasons to look into the SEM's performance. Here are some reasons you might need to review the steps below.
- If you are getting a managermonitor warning! Stating the the database is queuing.
- If rules or emails stop firing after a while, with a reboot fixing it temporarily.
- If you have problems loading Event Details when selecting an event in the "Events" tab
- If searches are taking too long to come back, or are not coming back with results.
- If you have a hard time getting to the SEM's web console, or if it takes longer than 10 minutes to access after a reboot.
Resolution
SEM Events Per Day
Find the events per day:
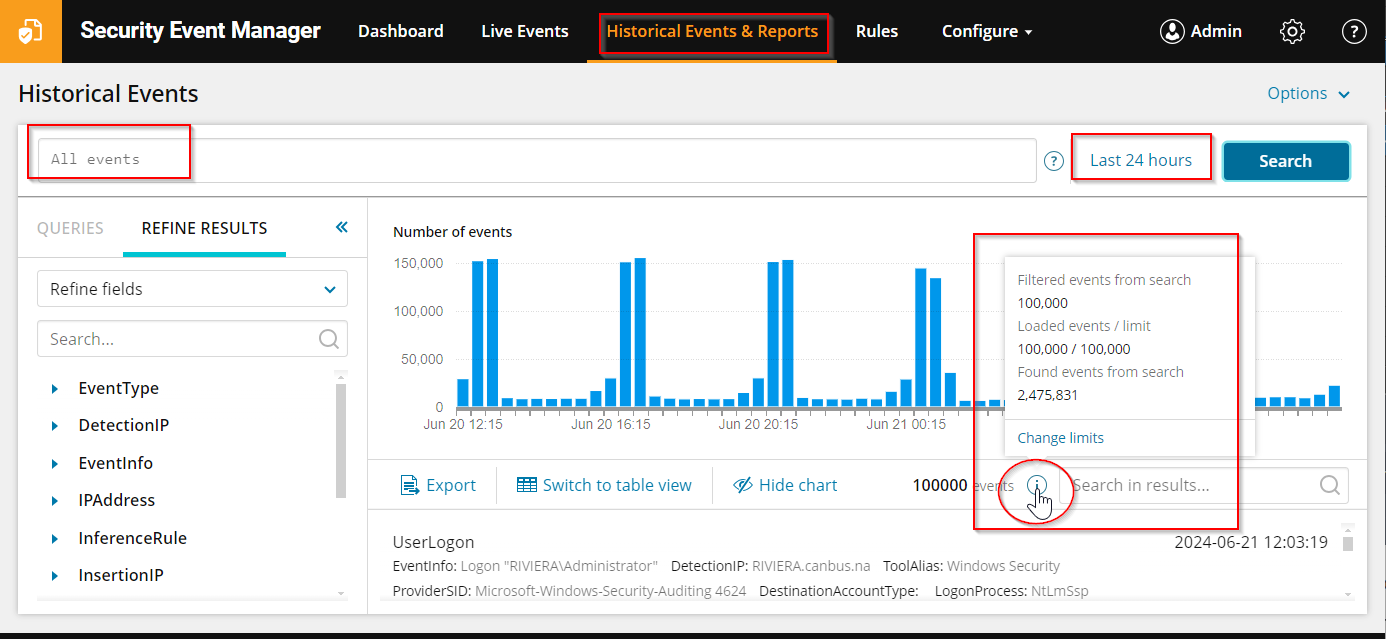
Virtual Machine Allocations
The following chart is a general guideline for how much CPU and RAM we recommend having reserved for your appliance, based on how many events you are receiving per day. The first tier of 2 CPU cores and 8 GB of RAM is how the SEM is configured by default.
It is important to not only allocate these resources, but also have them reserved. In Hyper-V this is normally done by default. In VMWare we deploy it with 8GB of RAM Reserved. We recommend matching this reservation amount as you increase the RAM allocated.
Any of the following reasons would require that you increase your allocation to the next tier.
It can also be important to validate Disk performance for the SEM. There are several ways to measure this, but we have estimated the values for this chart using a "dd" command that you would need to contact support to have run on your SEM directly.
You can run the diskusage command from the appliance submenu to see if data is being queued. This could mean poor disk performance or excessive rule activity. Any queueing in “alerts queued” or “alerts in memory” (ignore Database Queue -> “xxx alerts in memory”) would be a negative result here.
Running the top command from the same menu will let you see the load average in the upper right. This should normally hover around 2, but can be higher if you've assigned more CPU cores. If yours is consistently higher than the number of CPU cores assigned it could indicate misconfiguration of Rules or other SEM features.
Running the checklogs command from this menu will show you a list of facilities and their current size. If they receive more than 10GB a day it can interfere with the log rotating. Use the setlogrotate & limitsyslog commands to manage this.
Connector Configuration
Verify that all connectors are set to "Normalized" in their Output setting, unless you have manually enabled the Raw database. This is not enabled by default.
A connector is needed to read in data from each source whether that is a Network Device, OS, or specific piece of software. You can see which connectors you have configured using the steps in this article.
Configure SEM connectors for agent and non-agent devices
For syslog devices you may want to divide the facilities they log to based on the product types. This would be to prevent a connector from reading logs that match its format closely enough, but happen to be for a different product. This isn't always needed, but the most common example we see are with Cisco products. The link below discusses the best way to separate those.
Cisco connector best practices in SEM
It can also be helpful to review your Unmatched Connector Data to check for logs being read in by a connector that isn't designed for them. If these log lines are validated as being brought in by the right connector, we can request an update to that connector using the process in this article.
SEM-NTD Process using HTML Events console
Information to submit with a ticket
After reviewing the above information you may find that you still need assistance with resolving a performance issue. When opening a ticket it will generate a link to upload files to your case for review. The below information may be helpful to Technical Support for reviewing any remaining issue.
Filters
There are several Filters in the "Events" tab that can be helpful to review. Please make sure these indicate they have the max possible events listed (default 10000) and select the "Export to CSV" option to get the file.
Debug
This article will explain how to collect the debug file to upload.
Download debug logs
Find the events per day:
Virtual Machine Allocations
The following chart is a general guideline for how much CPU and RAM we recommend having reserved for your appliance, based on how many events you are receiving per day. The first tier of 2 CPU cores and 8 GB of RAM is how the SEM is configured by default.
| Events Per Day | CPU Cores | RAM |
| 0 to 15 Million | 2 | 8GB |
| 15 to 35 Million | 4 | 16GB |
| 35 to 60 Million | 6 | 24GB |
| 60 to 90 Million | 8 | 32GB |
| 90 to 130 Million | 10 | 64GB |
| 130 to 200 Million | 12 | 128GB |
It is important to not only allocate these resources, but also have them reserved. In Hyper-V this is normally done by default. In VMWare we deploy it with 8GB of RAM Reserved. We recommend matching this reservation amount as you increase the RAM allocated.
Any of the following reasons would require that you increase your allocation to the next tier.
- If the RAW Database is enabled
- For every 3000 rule firings per day
- For every 500 Unknown/Duplicate Agent nodes
- For every 3000 Unmatched data events per day
It can also be important to validate Disk performance for the SEM. There are several ways to measure this, but we have estimated the values for this chart using a "dd" command that you would need to contact support to have run on your SEM directly.
| MB/second | Million Events/Day capacity |
| 100 MB/s minimum | Up to 15 Million |
| 100-200 MB/s | Up to 30 Million |
| 200-300 MB/s | Up to 60 Million |
| 300-400 MB/s | Up to 120 Million |
| 400 MB/s + | Up to 200 Million |
You can run the diskusage command from the appliance submenu to see if data is being queued. This could mean poor disk performance or excessive rule activity. Any queueing in “alerts queued” or “alerts in memory” (ignore Database Queue -> “xxx alerts in memory”) would be a negative result here.
Running the top command from the same menu will let you see the load average in the upper right. This should normally hover around 2, but can be higher if you've assigned more CPU cores. If yours is consistently higher than the number of CPU cores assigned it could indicate misconfiguration of Rules or other SEM features.
Running the checklogs command from this menu will show you a list of facilities and their current size. If they receive more than 10GB a day it can interfere with the log rotating. Use the setlogrotate & limitsyslog commands to manage this.
Connector Configuration
Verify that all connectors are set to "Normalized" in their Output setting, unless you have manually enabled the Raw database. This is not enabled by default.
A connector is needed to read in data from each source whether that is a Network Device, OS, or specific piece of software. You can see which connectors you have configured using the steps in this article.
Configure SEM connectors for agent and non-agent devices
For syslog devices you may want to divide the facilities they log to based on the product types. This would be to prevent a connector from reading logs that match its format closely enough, but happen to be for a different product. This isn't always needed, but the most common example we see are with Cisco products. The link below discusses the best way to separate those.
Cisco connector best practices in SEM
It can also be helpful to review your Unmatched Connector Data to check for logs being read in by a connector that isn't designed for them. If these log lines are validated as being brought in by the right connector, we can request an update to that connector using the process in this article.
SEM-NTD Process using HTML Events console
Information to submit with a ticket
After reviewing the above information you may find that you still need assistance with resolving a performance issue. When opening a ticket it will generate a link to upload files to your case for review. The below information may be helpful to Technical Support for reviewing any remaining issue.
Filters
There are several Filters in the "Events" tab that can be helpful to review. Please make sure these indicate they have the max possible events listed (default 10000) and select the "Export to CSV" option to get the file.
- SEM Internal Events
- New Unmatched Connector Data
- Rule Activity
Debug
This article will explain how to collect the debug file to upload.
Download debug logs
- Tool Maintenance by Alias Report - for last 24 hours (high volume of unmatched data will consume resources to process the error.)
- Database Maintenance Report - no time frame (shows retention and traffic volume for last 20 days on bar graph)
- Inferred Alerts by Inference Rule - for last 24 hours ***Can take 30 minutes*** (these are the rules that fired to “infer”, not necessarily rules firing and sending emails.)