
Database Management
Deciding between Limited Mode or Full Mode in Monitoring Service Connection Properties for Watched Target in SQL Sentry
The purpose of this how-to article is to explain the difference between Limited and Full Mode for Monitoring Service Connection Properties.
First published date
6/16/2022 3:32 PM
Last published date
5/20/2025 6:04 PM
Overview
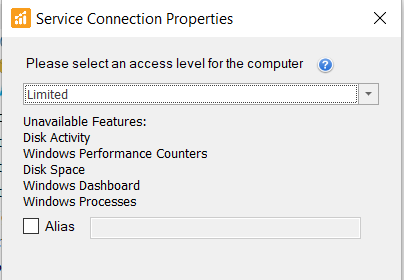
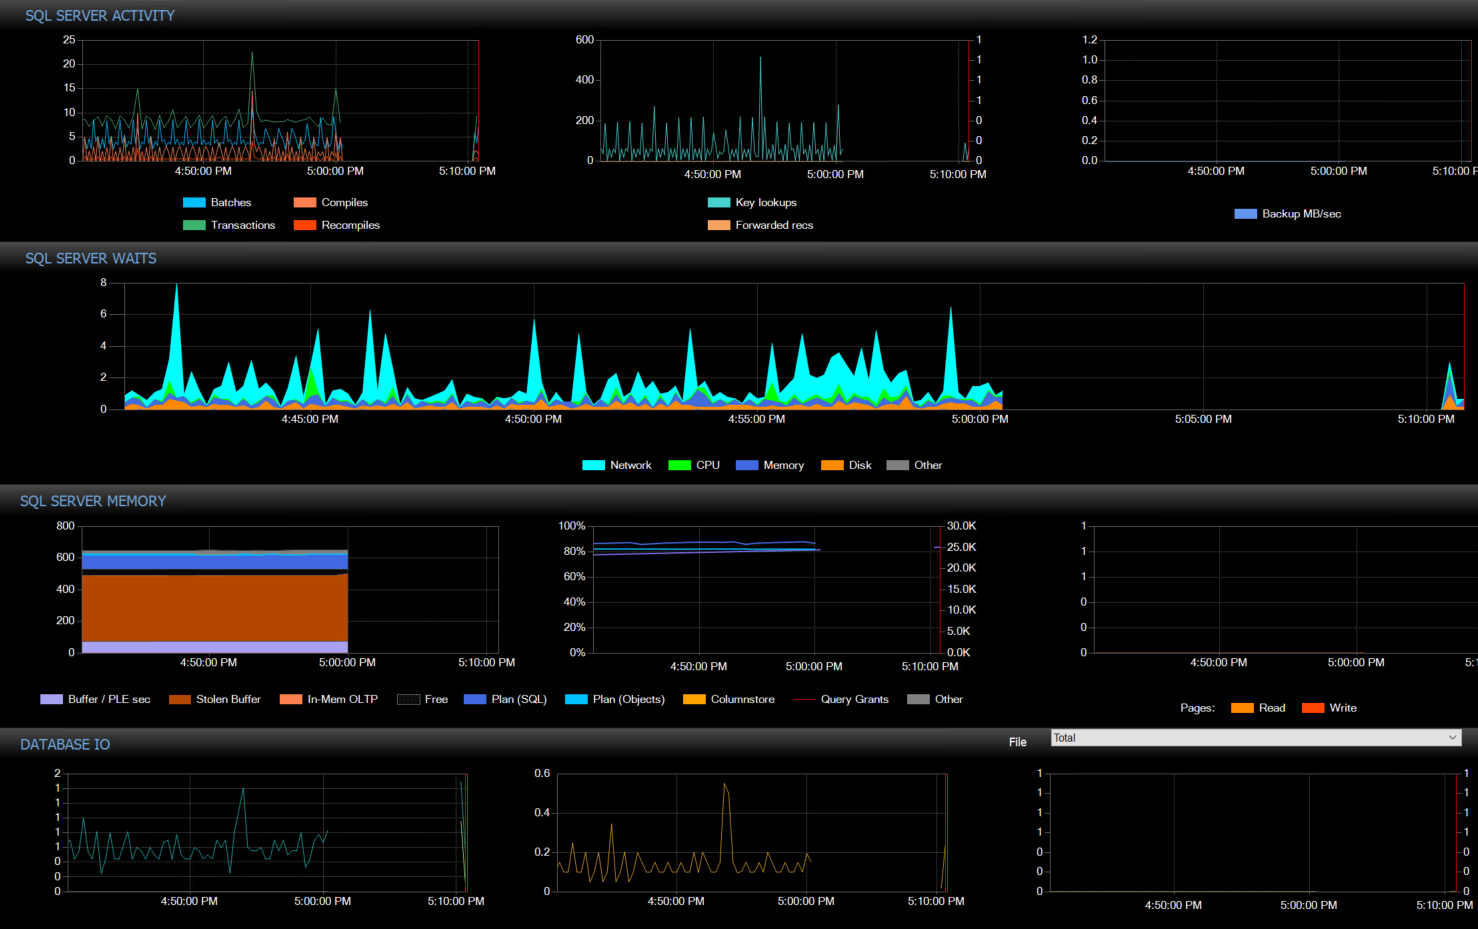
The purpose of Limited Mode is to only watch SQL Metrics. This use case is relevant if you need to watch a target across a domain and you cannot make any adjustments regarding domain trust or you only want users to only see SQL metrics. Full Mode will display Windows and SQL Metrics. In the event, that a target is set to Full Mode, and no metrics are collected, it is a great troubleshooting strategy to switch to Limited Mode and help narrow the issue down to WMI connectivity between the Monitoring Server and the Watched Target.
As a side note, SQL Sentry will automatically go into Limited Mode when choosing to monitor with a SQL account (Use Integrated Authentication is unchecked), and can sometimes happen when there are connectivity/permissions issues on the Server side, but not on the SQL side.
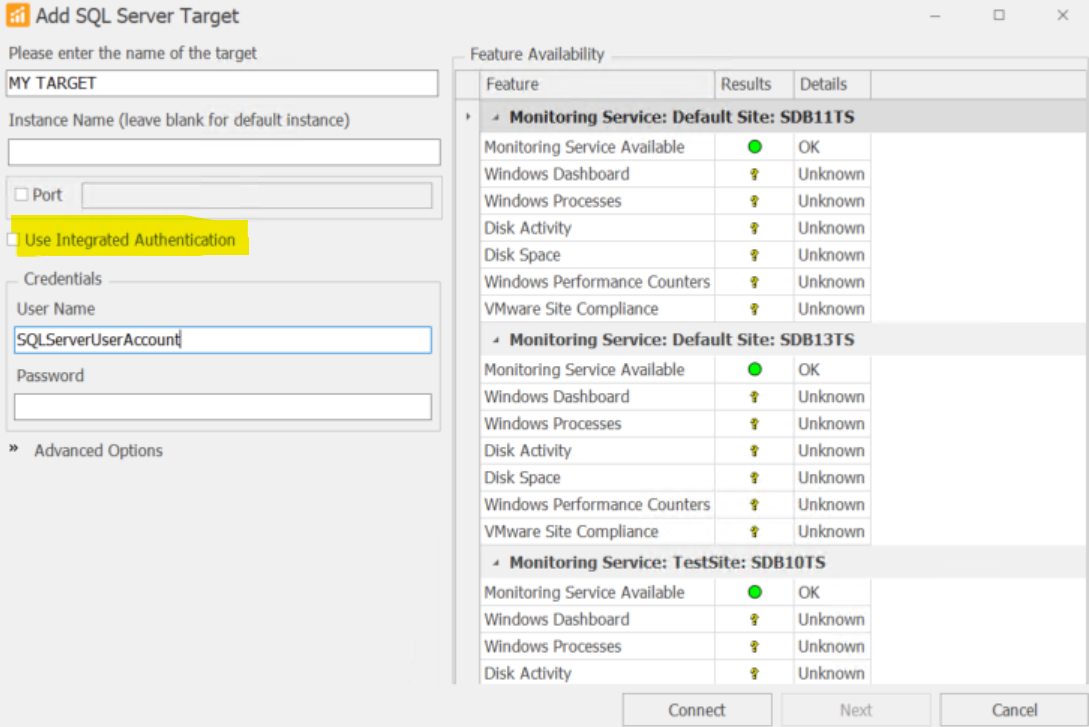
As a side note, SQL Sentry will automatically go into Limited Mode when choosing to monitor with a SQL account (Use Integrated Authentication is unchecked), and can sometimes happen when there are connectivity/permissions issues on the Server side, but not on the SQL side.
Product section
SQL Sentry (SQLS)
Resolution
Switch between Limited or Full Between the Monitoring Service Connection Properties of the Windows target(s) using the best judgment.
Steps to adjusting from Full Mode to Limited: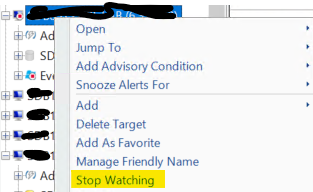
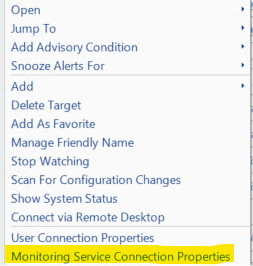
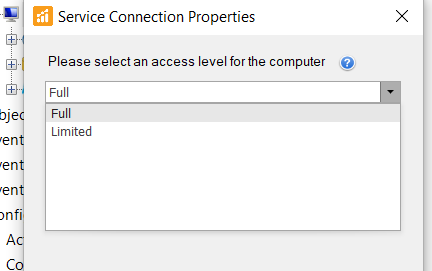
3. Select Limited Mode, then OK.
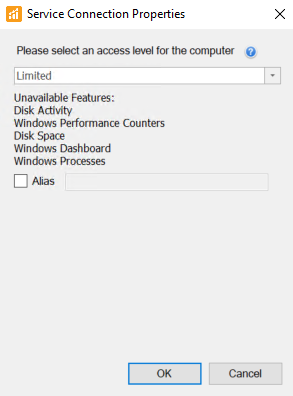
4. Rewatch SQL Target Instance and you will then notice only SQL Metrics Populate when launching Performance Analysis.
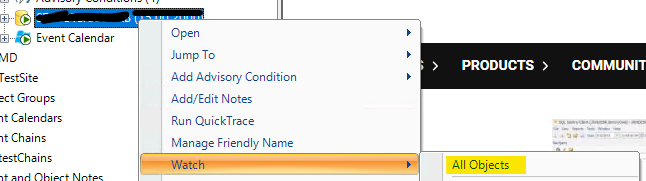
Steps to adjusting from Limited Mode to Full (No need to Unwatch Target when running through these steps):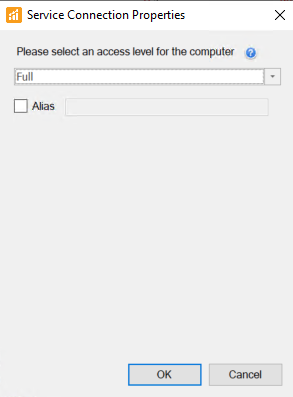
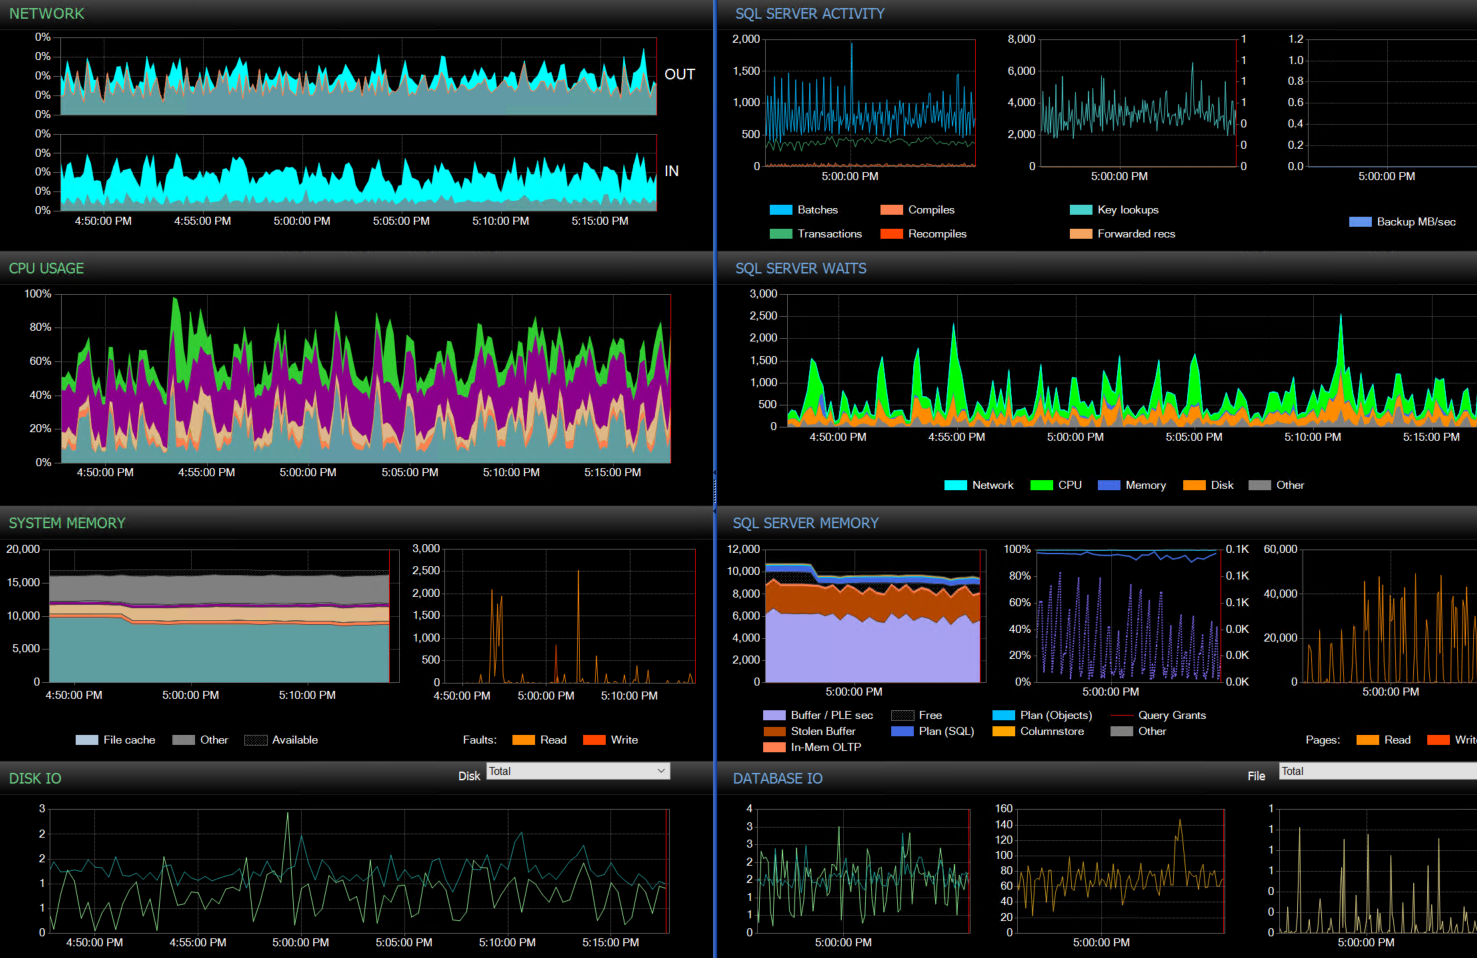
3. Launch Performance Analysis for Target in Question and you will see Windows and SQL Metrics Collecting:
Steps to adjusting from Full Mode to Limited:
- Open the Navigator in Client and Right Click and Unwatch SQL Target Instance:
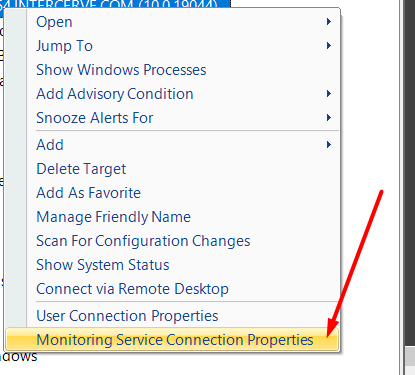
- Next Right Click and Unwatch the Windows Computer for Target, then Right Click again and Open Monitoring Service Connection Properties:
3. Select Limited Mode, then OK.
4. Rewatch SQL Target Instance and you will then notice only SQL Metrics Populate when launching Performance Analysis.
Steps to adjusting from Limited Mode to Full (No need to Unwatch Target when running through these steps):
- Open the Navigator in Client and Right Click on Windows Target and Select Monitoring Properties.
- Select Full Mode, then OK.
3. Launch Performance Analysis for Target in Question and you will see Windows and SQL Metrics Collecting: