
Network Management
Interface Bandwidth Utilization perfstack chart is blank
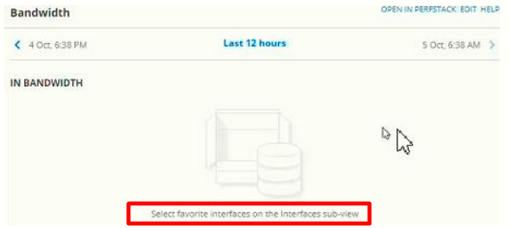
On a network device node details view the interface bandwidth utilization chart is blank
First published date
10/5/2020 4:51 PM
Last published date
10/5/2020 4:51 PM
Overview
This article provides information on steps to follow on how to fix the above issue - the issue is:
You have added some Network devices for example Cisco ASA or some other brand.
And when you go to node details, the following widget is blank i.e no data
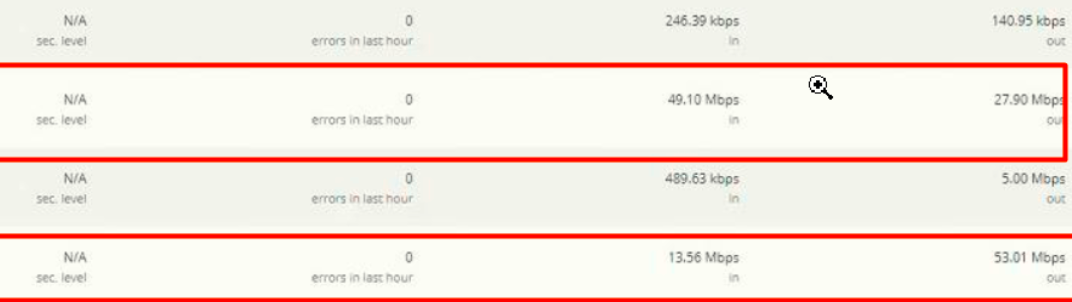
And when you click on the interface details tab you can see the bandwidth details and there is data. Ex:
You have added some Network devices for example Cisco ASA or some other brand.
And when you go to node details, the following widget is blank i.e no data
And when you click on the interface details tab you can see the bandwidth details and there is data. Ex:
Product section
Orion Platform
Cause
Favorite interfaces has not been selected
Resolution
First make sure you are not running into this issue No interface bandwidth utilization data available in NPM
Once confirmed that interface stats are collected. Follow the next steps
1. Click on the ASA or the network node in question to load the Node details page
2. Click on Interface Details tab (shown below)

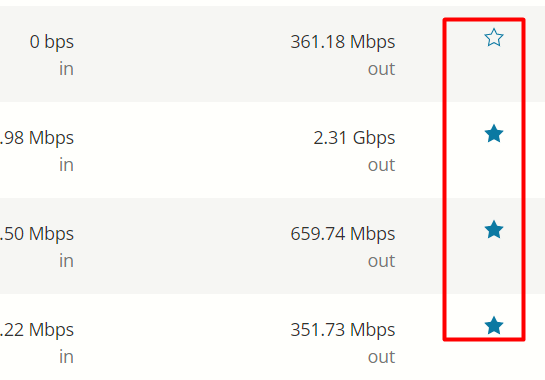
3. Scroll all the way to the right to see the Star symbols and click on the star to mark as favorite (dark blue)
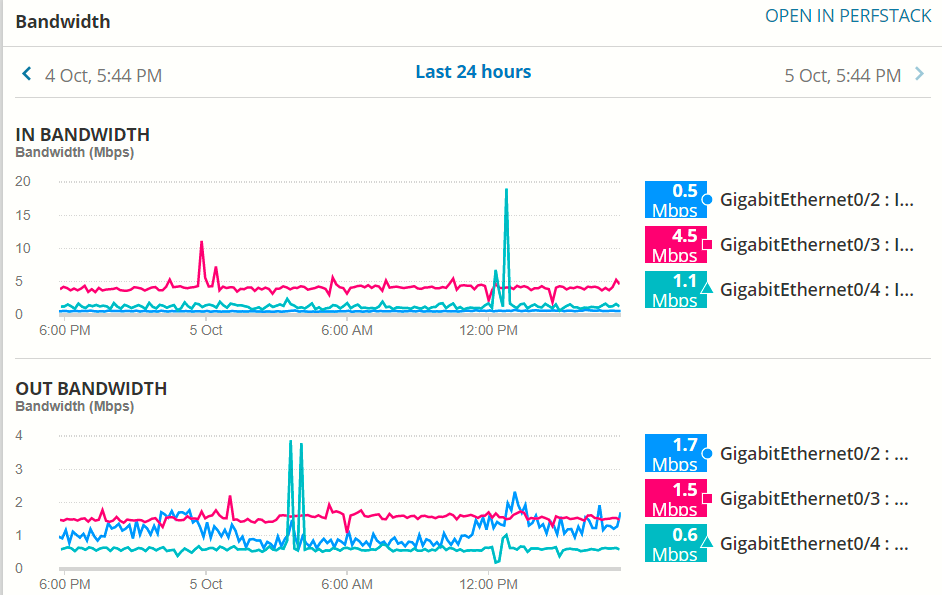
4. Now go back to node details page, and you should see the same interfaces' in/out traffic
Once confirmed that interface stats are collected. Follow the next steps
1. Click on the ASA or the network node in question to load the Node details page
2. Click on Interface Details tab (shown below)
3. Scroll all the way to the right to see the Star symbols and click on the star to mark as favorite (dark blue)
4. Now go back to node details page, and you should see the same interfaces' in/out traffic